My name is Vladimir Kukushkin. I’ve been working as a data analyst/data scientist for more than 10 years. A couple of years ago I heavily shifted to quantitative UX research area which turned into my passion. While eagerly trying to find some sources to read regarding this topic, I realized that there are not so many of them. That’s why I decided to write a series of posts towards quantitative UX research. Basically, it will be reviews of papers, books and other publications that I find insightful. I’d be happy to find here enthusiasts who are also interested in this domain.
Let me start our journal club with the most impressive paper related to clickstream visualizations I’ve ever read: Sequen-C: A Multilevel Overview of Temporal Event Sequences by Jessica Magallanes, Tony Stone, Paul D. Morris, Suzanne Mason, Steven Wood, and Maria-Cruz Villa-Uriol.
The authors address two very common issues that any quantitative UX researcher encounters:
- Clickstream data often comprises multiple behavioral paths. Treating and visualizing it as a whole is incorrect and often leads to contradictory results.
- Despite the fact that users follow certain (latent) scenarios, the ways they perform particular steps vary greatly: they may repeat the same steps multiple times, deviate from a scenario, or switch it. When analyzing such data, it’s hard to understand the patterns of repetition, deviation, and switching.
In the paper, the authors describe an interactive visualization tool that tackles both these issues and provides a methodology they call Align-Score-Simplify.
Methodology
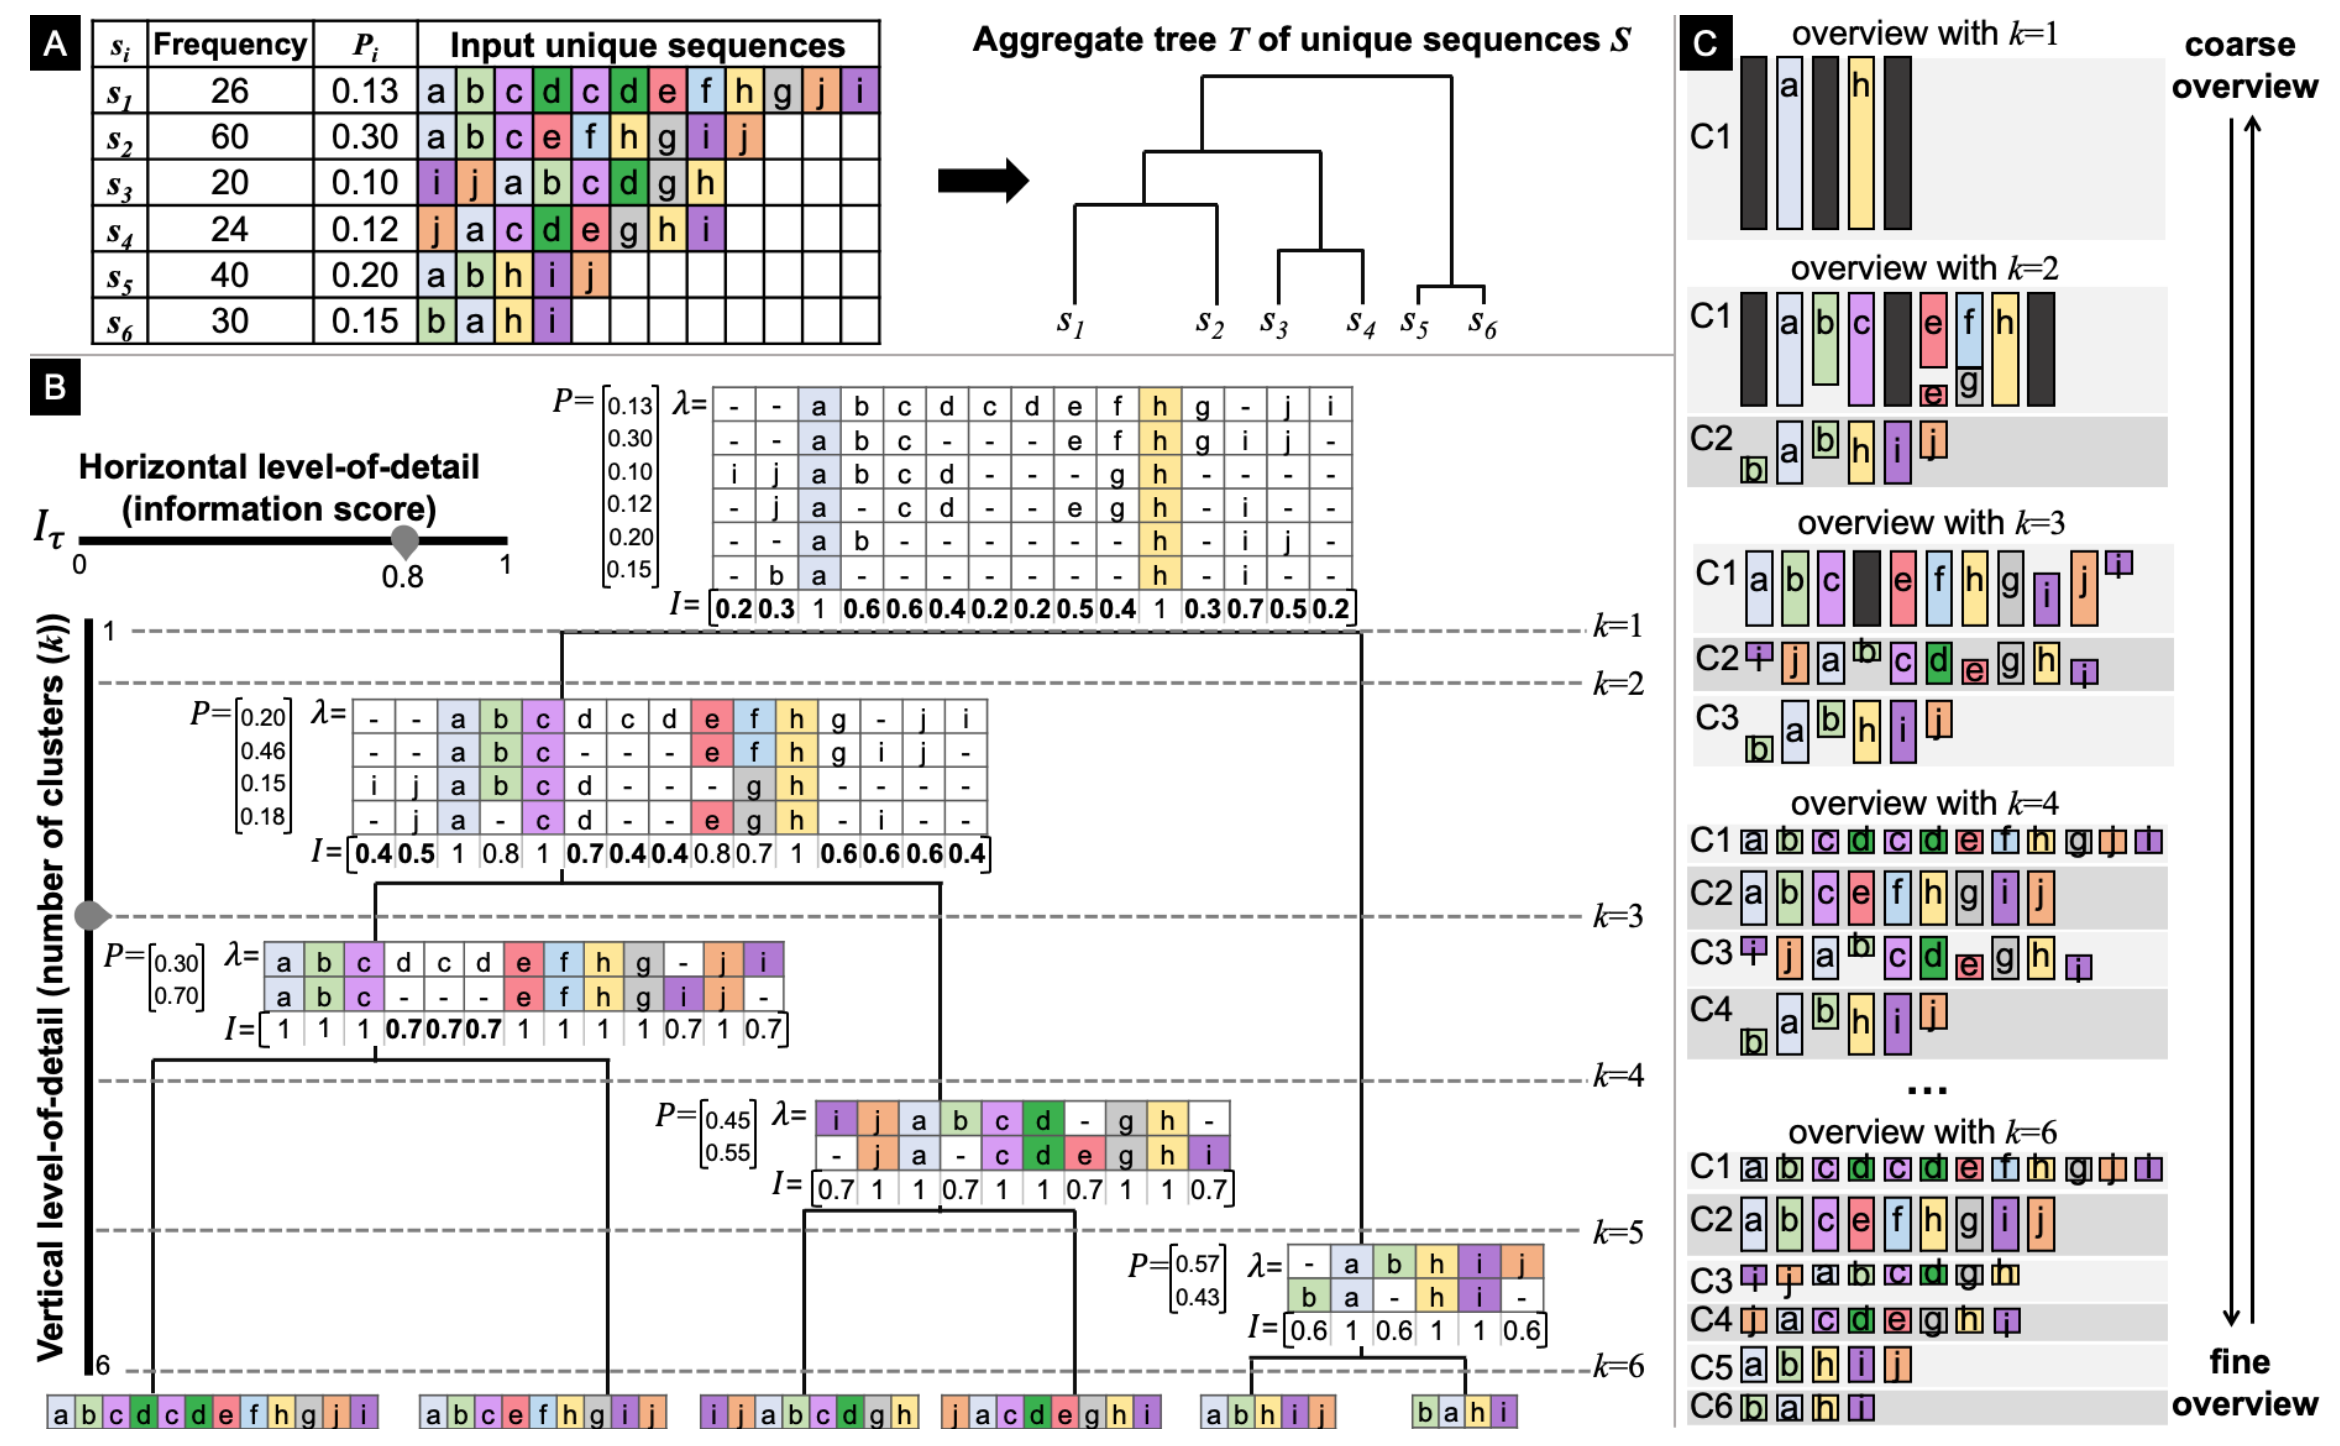
The first problem is addressed by applying (agglomerative) clustering. I’ll explain further why they chose this algorithm. The second problem is solved using their framework called Align-Score-Simplify.
Align
This part is the most elegant, amazing, and surprizing in the whole paper. They apply the MSA algorithm (Multiple Sequence Alignment) stemming from bioinformatics. Originally, it was created to align amino acids or nucleotides in DNA sequences to identify common subsequences across DNAs belonging to multiple species. But this is exactly one of the goals we pursue in clickstream data analysis. Once we align user trajectories in similar way, we understand what events are common for the most users at some specific steps.

- as gaps to align events in sequences. The coloured events might be considered as common at some steps. The others are considered as noise.
Score
Let \(\lambda\) be the output of the MSA algorithm applied to a set of unique sequences \(S\) (the frequency of each path is denoted as \(P_i\)). They calculate the information score \(I_j\) for each column \(j\) in \(\lambda\) as a measure of the column’s impurity, somewhat similar to entropy but with some additional penalty for the high amount of gaps:
\[ I_j = 1 - \frac{E_j}{\log_2(|A| + 1)}, \;\;\;\; E_j = \sum_{a\in A_j\cup\{-\}} \begin{cases} -P_a\log_2\left(\frac{P_a}{G_j}\right)\, & \text{if } a = \text{'-'}\\ -P_a\log_2 P_a, & \text{otherwise}, \end{cases} \]
where
- \(A\) – the set of unique events in \(S\),
- \(A_j\) – the set of unique events in column \(j\),
- \(P_a\) – the probability of the event \(a\) in column \(j\),
- \(G_j\) – is the count of gaps in column \(j\).
Simplify
Once the \(I_j\) score is calculated for each column \(j\), we can treat each column that exceeds a certain threshold \(I_\tau\) as an event that prevails in this column, while all other columns might be collapsed as noise. As a result, we get a new table \(\alpha\) that simplifies the initial clickstream \(S\), as shown in the image below.

Finally, we can granulate our clickstream representation using two axes:
- We can consider different clusters of the agglomerative clustering output tree \(T\). Now it’s clear why they preferred this clustering algorithm instead of, say, K-Means. Considering different levels of \(T\), we obtain more/less homogeneous clusters. More homogeneous clusters provide better and clearer output of the MSA algorithm.
- \(\tau\). By varying \(\tau\), we can make the sequence visualization more/less coarse.
As a result, we get the interface like this:

In the following sections, the authors describe the GUI of a more complex tool developed as an application for a couple of particular datasets from the public health domain. I won’t talk about it here since its underlying idea is the same, while the interface is more sophisticated and includes some information about events distribution, unique sequence view, and individual sequence view.
The datasets are more related to process mining, so the event cardinality is low. This is much lower than what happens in product analytics. The paths are very structured with few deviations from the main flow. That’s why I’m quite skeptical about applying this framework to product analytics clickstream data. Additionally, it’s not clear how fast MSA would work with clickstream data.
Anyway, the idea of the paper and the framework are super interesting to me. It would be great to implement such a tool someday.